Crosswords
I’ve been doing the New York Times crossword every day for a few years now, manually saving a record of every puzzle I complete and how long it took me. This has developed into quite the dataset at this point, so I figured it’d be fun* to use it to learn how to make and publish interactive figures. Plotting the data like this has revealed some pretty interesting* insights that I’ll explain below the figure. (The visualization should take a few seconds to load.)
* For certain values of the word.
Analysis
Notable patterns
(If you’re not familiar with the crossword, have a look at the next section first.)
- In the first year of the dataset, Wednesdays were sort of my nemesis—for whatever reason, sometimes I’d just get stuck! That hasn’t really happened since, and at this point Wednesdays are much closer to Monday/Tuesday difficulty than Thursday for me. But I still think that the death of my streak will come, if not through sheer forgetfulness, then at the hands of a weird Wednesday.
- By the beginning of 2020, I seemed to have gotten the hang of Sundays—after hovering around a 20-minute average, I’ve been trending faster since then.
- Sometime around June 2020, I started solving Fridays faster than Thursdays, and that trend has continued. At this point, somehow, my average Friday time is closer to my average Wednesday than my average Thursday! My hypothesis for this is that Thursdays often have tricky themes or features like rebuses (where more than one letter goes in a square) that can trip me up, whereas Fridays being themeless makes things more consistently smooth.
NYT crossword basics
The New York Times crossword publishes every day in print and online. Puzzles generally tend to increase in difficulty from Monday to Saturday; Sundays are much larger puzzles (usually 21x21 squares, as opposed to 15x15), but are about Thursday difficulty in terms of their cluing.
I solve using the iOS app, which is surely faster than I’d manage with paper, but probably not as fast as if I learned to solve with my laptop. This dataset only includes puzzles that the app credits me as having solved with no hints on the day they came out (“yellow stars” in the archive), although there is some leeway—I can solve after midnight here in Germany and still get credit. I don’t allow myself the use of any external resources for figuring out clues.
Technical details
Record-keeping
The NYT Crossword app tells you how long you took to complete a puzzle and provides an easy way to see some information about your history, like your personal record for each day of the week. As far as I can tell, though, there’s no way to get all the data out en masse, so I’ve been saving my completion times manually. For a while this was a Google Sheet, but that was annoying to work with on my phone (where I do all my solving). To streamline the process, I cobbled together an iOS Shortcut that would ask me for the relevant info:
- Puzzle date?
- Solve date?
- Solve time (duration)?
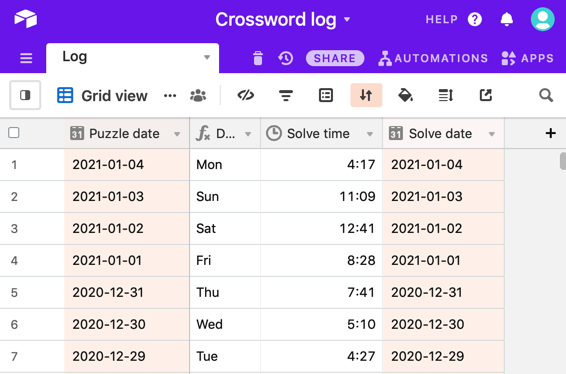
and save it—along with the puzzle’s day of the week, which the Shortcut determined automatically—to a new row in a .csv file in my Dropbox. But that felt pretty fragile. When Apple made some changes to the Shortcuts app with iOS 14 that made it really annoying to use, I switched to Airtable, which is what I’m using now:
Visualization
The visualization is an interactive web app built using Shiny for R, hosted for free on shinyapps.io. The code for it can be found on my Github.